I have wanted to learn how to profile JBoss with Eclipse for a while now, but wasn’t able to find any good documentation on the web. I finally got the time to figure out all the pieces to the process, so here are my notes.
These notes will refer to the Eclipse profiler plugin known as “EclipseColorer” which is maintained at http://sourceforge.net/projects/eclipsecolorer/ . There are some other profiling modules in existence, but this one seems to be the most active and complete.
The first piece that was missing was any definitive evidence that it ran with a modern version of JBoss. The most recent documentation stated it had been confirmed to work with “jboss-3.0.6_tomcat-4.1.18”. So let me just state for the record: I have EclipseColorer version 0.5.31 (dated May 24, 2004) running with JBoss 4.0.0RC1 under Windows and Linux.
Missing Mac Support
It is important to note that the profiler has two components: the part that gathers profiling data and the part that displays the gathered statistics in Eclipse. The first component does not run under Mac OS X–only Windows and Linux/Unix. The second component seems to run under all platforms.
What does this mean? You can run JBoss in a Java VM running on a Linux or Windows computer and have its profiling statistics gathered on a Mac. Read on and you’ll understand what I mean.
JBoss must run in a separate VM!
If you like to run JBoss under the Eclipse debugger (via JBossIDE) you should understand that you cannot use this configuration while profiling. (Actually, that may not be true, but my instructions won’t work that way and I wouldn’t suggest it. The profiler makes JBoss run REALLY SLOW so you’ll be better off having a “special configuration” that you can launch when you profile.)
So this is what’s going to happen: you will Run the Profiler under Eclipse (and switch to the Profiler Perspective) which will listen patiently to port 6743. Next you will startup JBoss with some special parameters so that it loads a special profiling library. It will start broadcasting profiling data on port 6743. Eclipse and JBoss will talk to each other on that special port (6743) and voila! you be able to explore the data under Eclipse!
Configuration Part 1: Eclipse
Here are the steps:
1. Download the EclipseColorer Profiler plugin from its Sourceforge home. Unzip the file into your Eclipse program’s “plugins” directory. It’s best to quit Eclipse, install the plugin, and then restart Eclipse.
2. Go into the directory that you just installed. One thing to note: there is a “doc” subdirectory with an index.html page that gives instructions for installation and operation. These notes are to supplement those instructions.
3, There’s a library (one for Windows, another for Linux) that you’ll have to install in your JVM to get things to run. Its installation is covered in the second section (Part 2).
4. In Eclipse, from the Run pull-down menu, select “Run…”
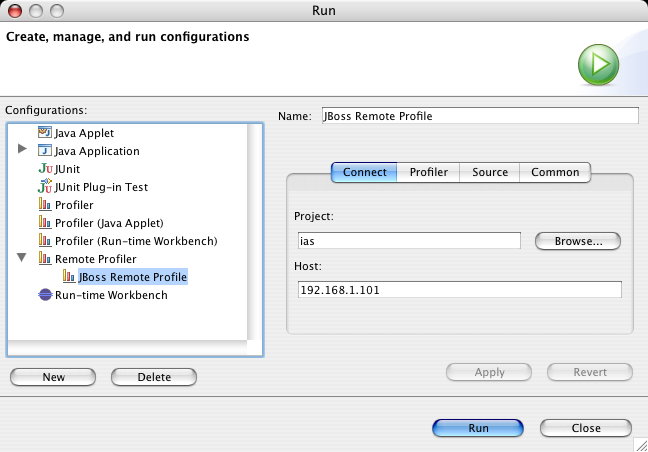
In the Configurations section, highlight “Remote Profiler” and click the New button. Set the “Name:” text field to something appropriate. Hit the Browse… button and select your JBoss project that you are working on. Finally, under “Host:” put the IP address of the machine which will be running JBoss. If it’s the same machine, you’ll probably want to put localhost (127.0.0.1).
That’s pretty much it. You can click on Close, or you might just go ahead and click “Run” to start the Profiler running. If it doesn’t automatically switch to the Profiler perspective, switch to it manually.
Configuration Part 2: JBoss
1. On the machine that will be running JBoss, you must add a library to the Java VM under which JBoss will be started. Find the location of that VM and go there.
2a (Windows) In the EclipseColorer plugin directory that you installed under Eclipse, there is a DLL file called “ProfilerDLL.dll”. Copy that file into the jre/bin subdirectory of your Java VM.
2b (Linux) Instead of “ProfilerDLL.dll” you will want to go into the “native” subdirectory of the EclipseColorer plugin directory. There will be a file called “profiler_linux.tgz”. Expand that archive. If you are lucky and running a compatible version of Linux (i386 with a newer gcc & libraries) you can use the file “libProfilerDLL.so”. Otherwise you will have to figure out how to compile a new binary for yourself. On my system, the Java directory had a jre/lib/i386 subdirectory. I was able to copy “libProfilerDLL.so” in there and things worked. You may have to experiment if your Java installation has a different directory structure.
3. Go into the “bin” directory of your JBoss installation. Make a copy of “run.sh” (for Windows, “run.bat”) and call it something like “run-profiler.sh”.
4. Edit the file. Wherever your JAVA_OPTS line is defined, you will find some line that says:
JAVA_OPTS="$JAVA_OPTS ...maybe some stuff... -Dprogram.name=$PROGNAME"
(For Windows the run-profiler.bat you edit may look a little different.)
You will want to insert into that line (somewhere where I wrote “maybe some stuff” above) the following:
-XrunProfilerDLL:1 -Xbootclasspath/a:jakarta-regexp.jar:profiler_trace.jar:c

ommons-lang.jar -D__PROFILER_PACKAGE_FILTER=__A__org.jboss.Main;__M__sun.;__M__com.sun.;__M__java.

;__M__javax. -D__PROFILER_TIMING_METHOD=1
(Look closely at that line. Some of those underscores are double-underscores. In discussion groups I saw instances where people didn’t copy this correctly. Best to cut ‘n paste.)
(Windows users: the colons in the -Xbootclasspath option should be changed to semi-colons, as that’s the path separator under Windows.)
5. (This is a little sloppy, but I’m following the directions here.) Under the EclipseProfiler plugin directory, there are three jar files you will want to copy into this jboss/bin directory: commons-lang.jar, jakarta-regexp.jar and profiler_trace.jar.
6. That should do it. Try starting up JBoss by executing “run-profiler.sh”. You will probably notice that JBoss is running really slowly. That’s the overhead of the profiler.
You’re On Your Own Now!
Go to the Profiler perspective under Eclipse., You should see some threads listed under the “threads” view if the two are talking to each other. You can troubleshoot the connection by running “telnet <address> 6743” where <address> is the IP address of the machine running JBoss. If you get connection refused, something isn’t set up under JBoss. If you get a connection, then the profiler is ready to provide profiling into to Eclipse.
From here you should refer back to the EclipseColorer documentation to learn how to use the interface. Note that for me the include/exclude filters didn’t seem to be working right, as EVERY package and class seemed to be getting shown. I may post another blog entry if I get that figured out any better.
Excellent tutorial! It worked immediately and gave me a lot of useful infos.
A hint: Add more packages to -D__PROFILER_PACKAGE_FILTER= option, e.g.:
– org.jboss (don’t want to profile JBoss but my deployed apps)
– org.apache (guess they do know how to write performing code…)
– COM.rsa (that’s CORBA stuff)
– org.mortbay (in case JBoss is packed with Jetty)
Thankyou! This was extremely useful!
hi murray,
i have a query ,
after configuring jboss after reading this you website , i have been able to successfully run the edited run.bat file and is running fine, also i have configured “eclipse proflier” in Eclipse and entered the remote configuration
however, when i try to run profiler from “run”
and after manually switching to profiler perspective nothing is displayed …
please help